Datadog
With Datadog LLM Observability, you can investigate the root cause of issues, monitor operational performance, and evaluate the quality, privacy, and safety of your LLM applications.
Step 1: Create a Datadog API key
In Datadog, go to Organization Settings > API Keys and create a new key.
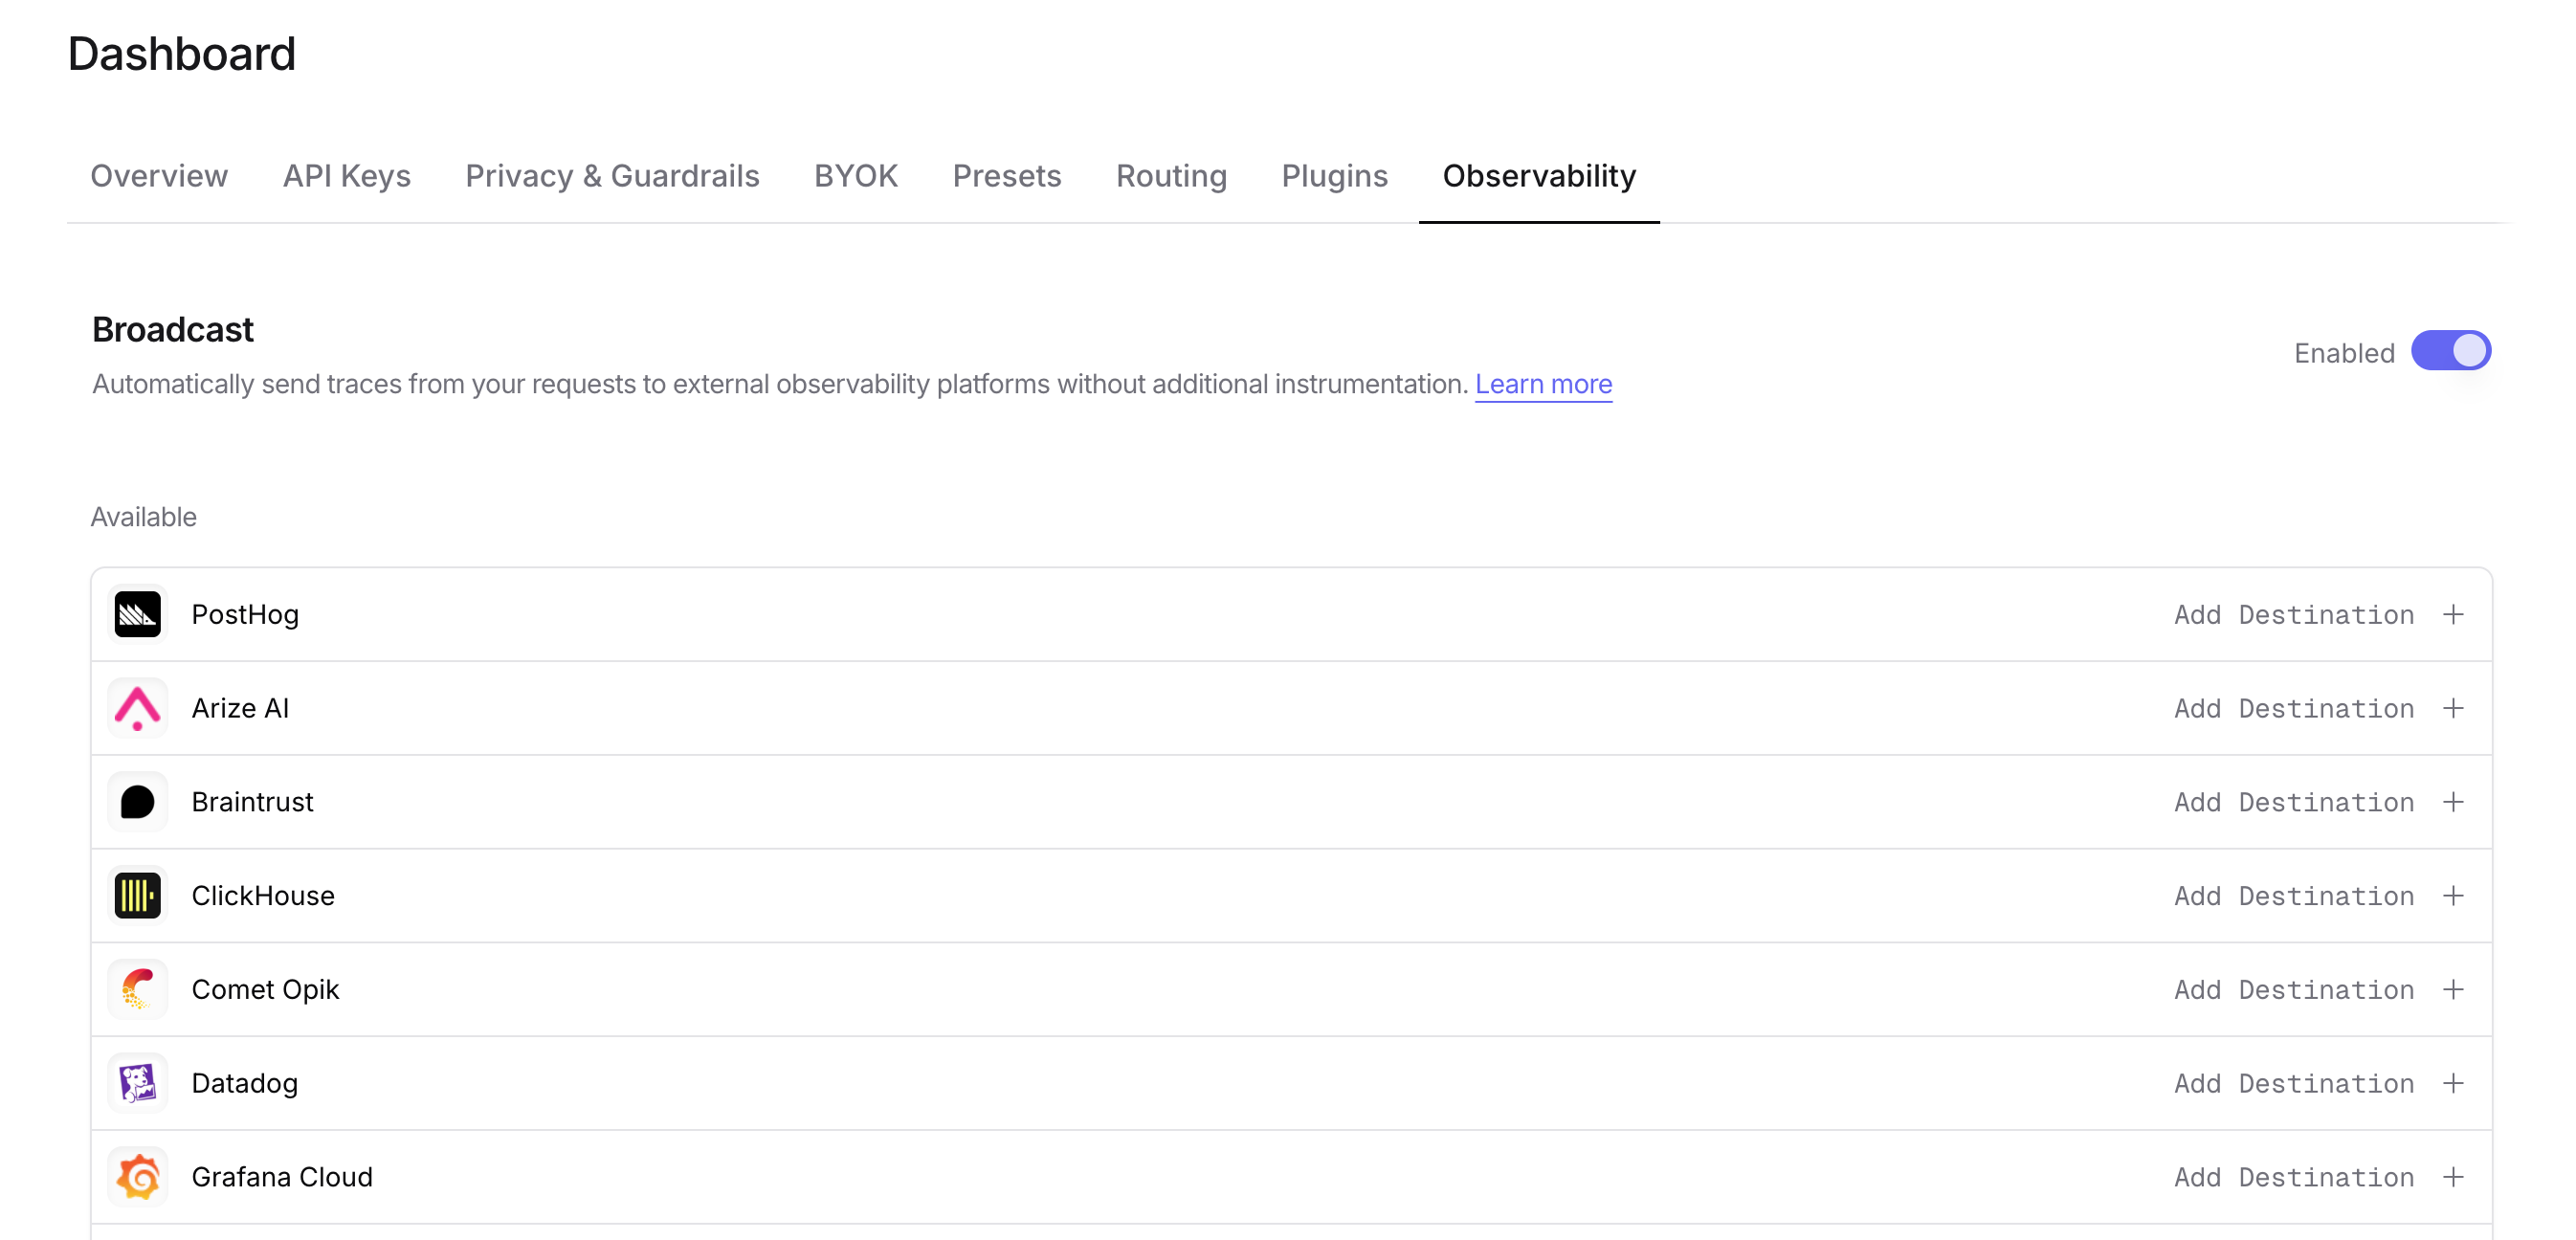
Step 2: Enable Broadcast in OpenRouter
Go to Settings > Observability and toggle Enable Broadcast.
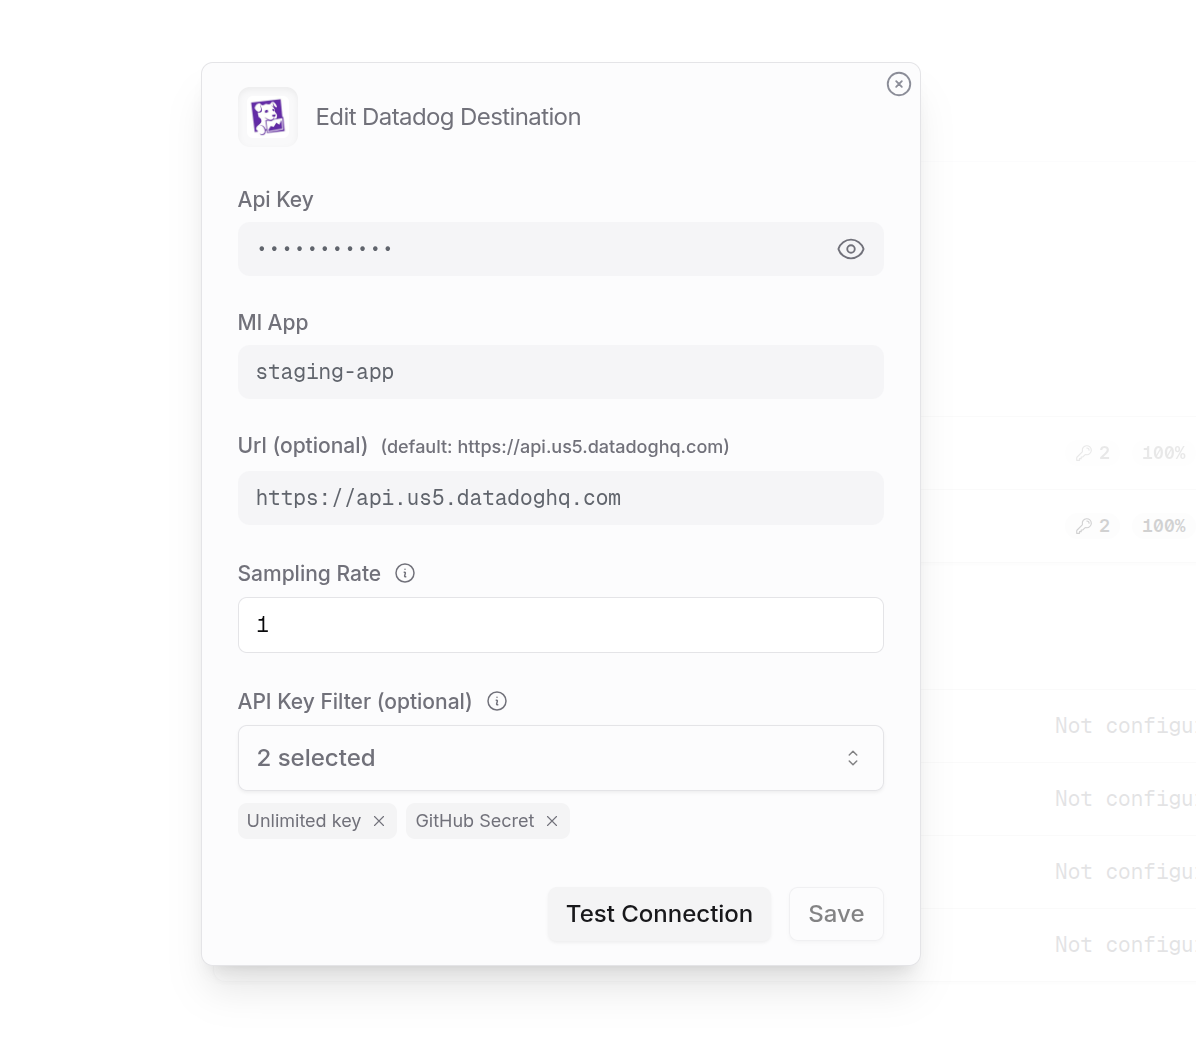
Step 3: Configure Datadog
Click the edit icon next to Datadog and enter:
- Api Key: Your Datadog API key
- Ml App: A name for your application (e.g., “production-app”)
- Url (optional): Default is
https://api.us5.datadoghq.com. Change for other regions
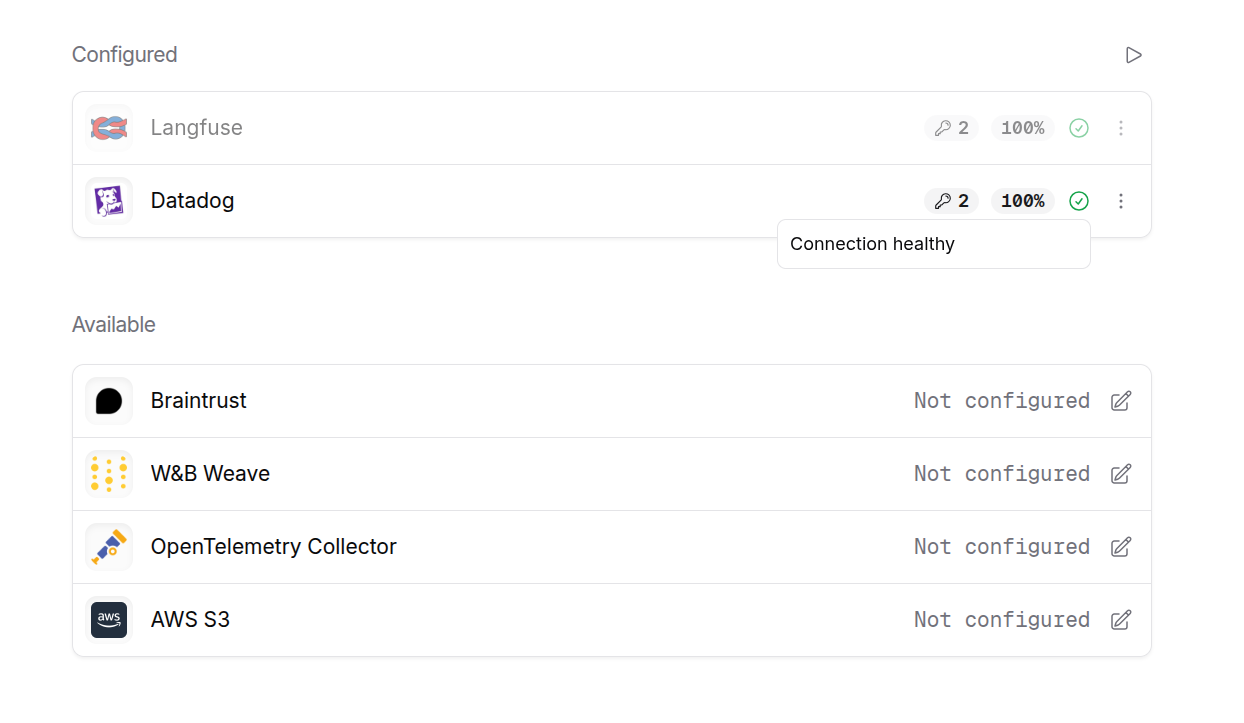
Step 4: Test and save
Click Test Connection to verify the setup. The configuration only saves if the test passes.
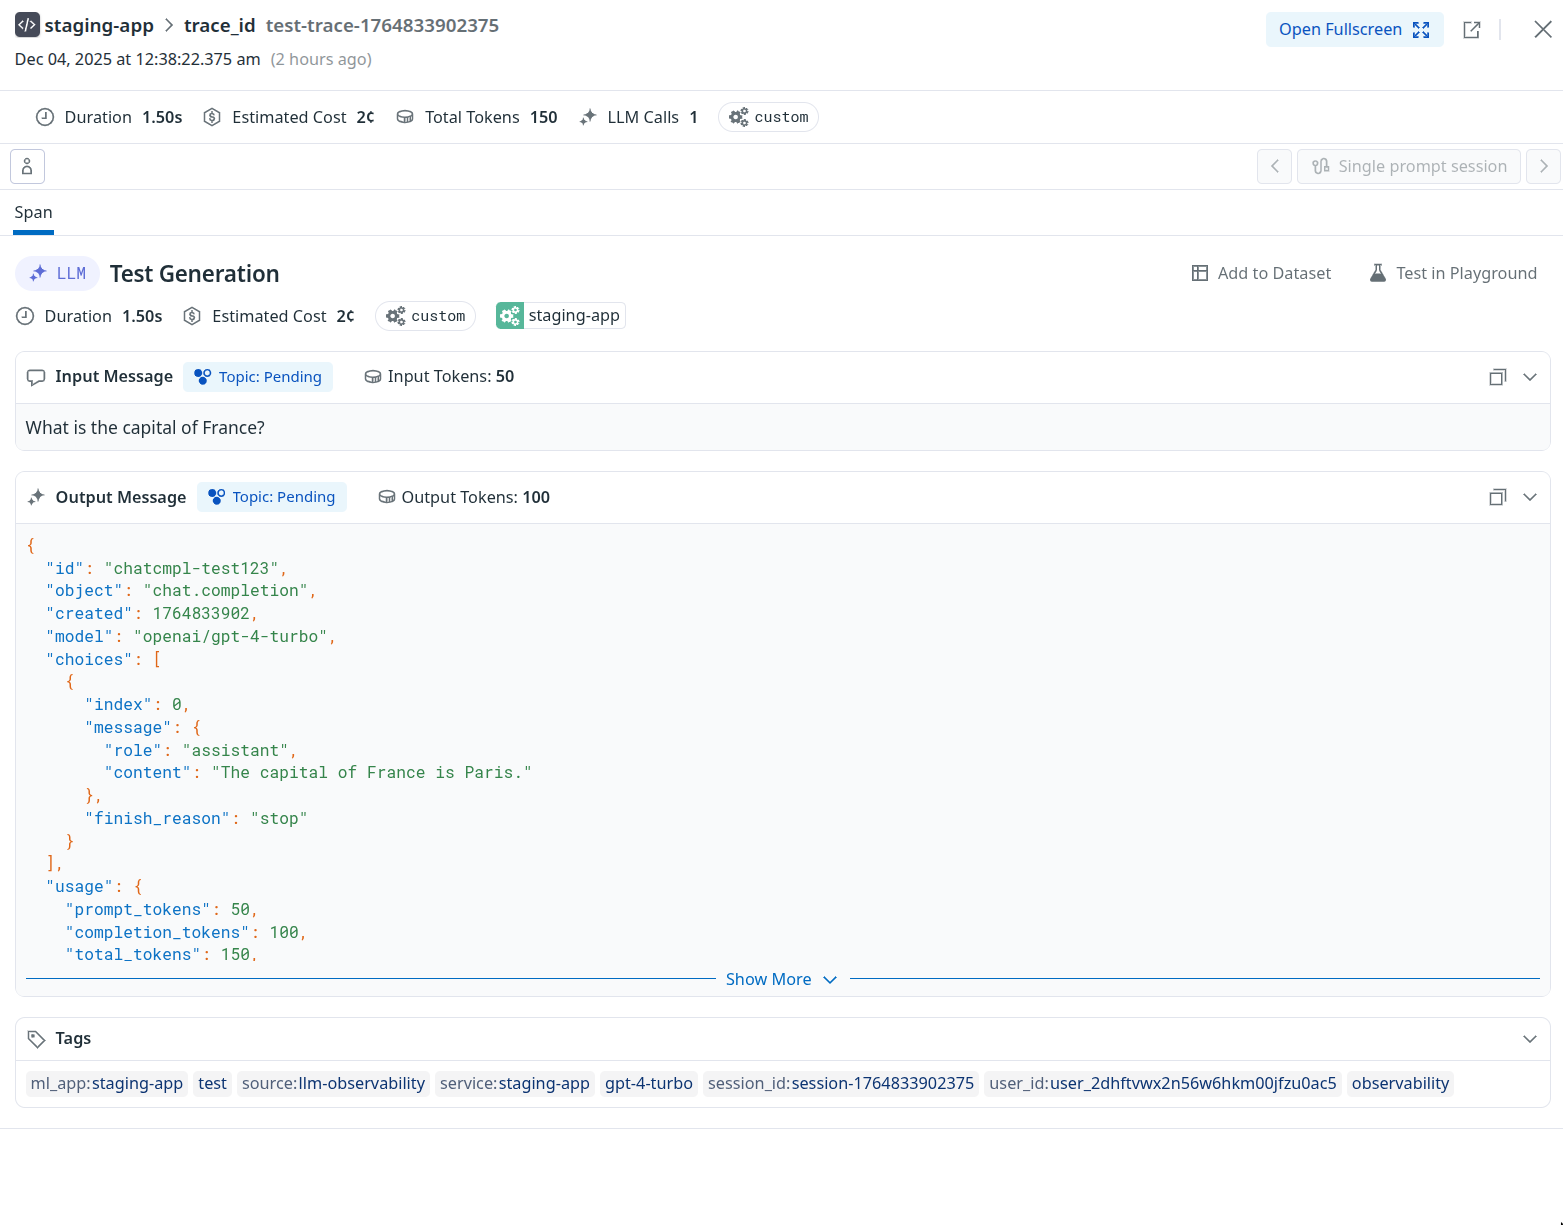
Step 5: Send a test trace
Make an API request through OpenRouter and view the trace in Datadog.
Custom Metadata
Datadog LLM Observability supports tags and custom metadata for organizing and filtering your traces.
Supported Metadata Keys
Tags and Metadata
Datadog uses tags for filtering and grouping traces. The following are automatically added as tags:
service:{ml_app}- Your configured ML App nameuser_id:{user}- From theuserfield in your request
Any additional keys in trace are passed to the span’s meta object and can be viewed in Datadog’s trace details.
Example
Viewing in Datadog
In Datadog LLM Observability, you can:
- Filter traces by tags in the trace list
- View custom metadata in the trace details panel
- Create monitors and dashboards using metadata fields
Privacy Mode
When Privacy Mode is enabled for this destination, prompt and completion content is excluded from traces. All other trace data — token usage, costs, timing, model information, and custom metadata — is still sent normally. See Privacy Mode for details.