OpenTelemetry Collector
Send traces to any OpenTelemetry-compatible backend
OpenTelemetry is an open-source observability framework for collecting, processing, and exporting telemetry data. OpenRouter can send traces to any backend that supports the OpenTelemetry Protocol (OTLP), including Axiom, Jaeger, Grafana Tempo, and self-hosted collectors.
Step 1: Get your OTLP endpoint and credentials
Set up your OpenTelemetry-compatible backend and obtain the OTLP traces endpoint URL along with any required authentication headers.
For Axiom:
- Create an Axiom account and dataset
- Go to Settings > API Tokens and create a new token
- Your endpoint is
https://api.axiom.co/v1/traces - You’ll need headers:
Authorization: Bearer xaat-xxxandX-Axiom-Dataset: your-dataset
For self-hosted collectors:
- Deploy an OpenTelemetry Collector with an OTLP receiver
- Configure the receiver to listen on a publicly accessible endpoint
- Note the endpoint URL (typically ending in
/v1/traces)
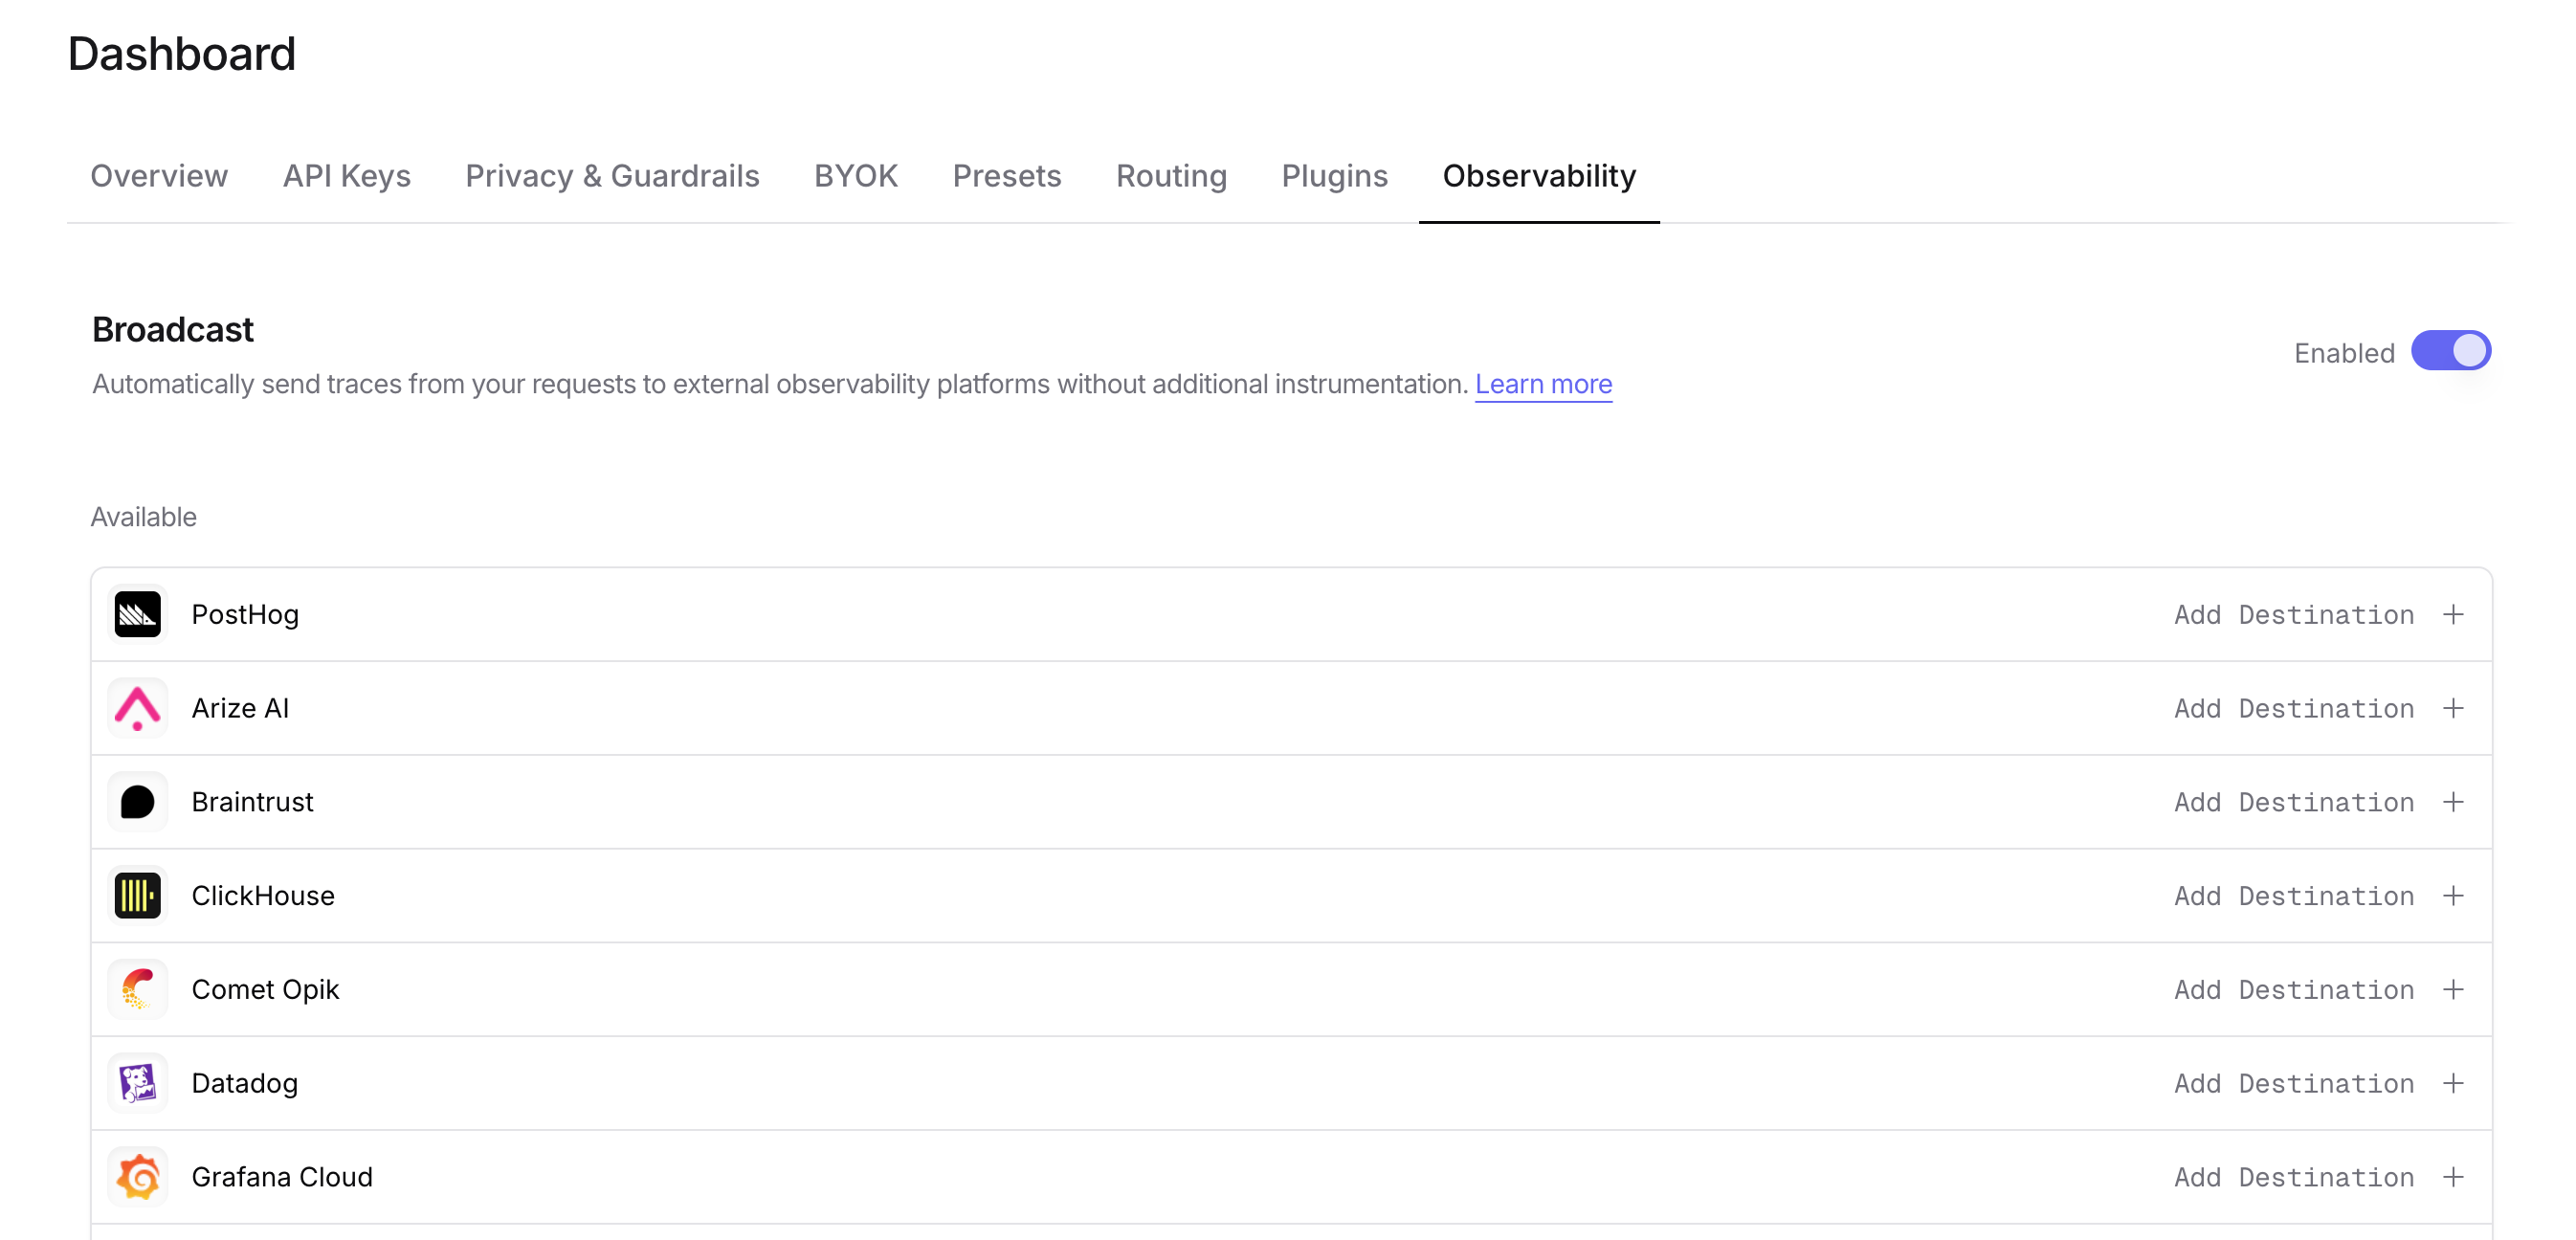
Step 2: Enable Broadcast in OpenRouter
Go to Settings > Observability and toggle Enable Broadcast.
Step 3: Configure OpenTelemetry Collector
Click the edit icon next to OpenTelemetry Collector and enter:
- Endpoint: Your OTLP traces endpoint URL (e.g.,
https://api.axiom.co/v1/tracesorhttps://your-collector.example.com:4318/v1/traces) - Headers (optional): Custom HTTP headers as a JSON object for authentication
Example headers for Axiom:
Example headers for authenticated collectors:
Step 4: Test and save
Click Test Connection to verify the setup. The configuration only saves if the test passes.
Step 5: Send a test trace
Make an API request through OpenRouter and view the trace in your OpenTelemetry backend.
Compatible backends
The OpenTelemetry Collector destination works with any backend that supports OTLP over HTTP, including:
- Axiom - Cloud-native log and trace management
- Jaeger - Distributed tracing platform
- Grafana Tempo - High-scale distributed tracing backend
- Honeycomb - Observability for distributed systems
- Lightstep - Cloud-native observability platform
- Self-hosted OpenTelemetry Collector - Route traces to multiple backends
OpenRouter sends traces using the OTLP/HTTP protocol with JSON encoding. Ensure your collector or backend is configured to accept OTLP over HTTP on the /v1/traces path.
Custom Metadata
Custom metadata from the trace field is sent as span attributes in the OTLP payload. How this metadata appears depends on your downstream backend.
Supported Metadata Keys
Example
Span Attributes
Custom metadata keys are included as span attributes under the trace.metadata.* namespace. For example, environment from the trace field becomes trace.metadata.environment in the OTLP payload.
Standard GenAI semantic conventions (gen_ai.*) are used for model, token usage, and cost attributes.
Additional Context
- The
userfield maps touser.idin span attributes - The
session_idfield maps tosession.idin span attributes - Your downstream backend determines how these attributes are indexed, queried, and displayed
- Using
parent_span_idlets you link OpenRouter traces to your application’s existing distributed traces
Privacy Mode
When Privacy Mode is enabled for this destination, prompt and completion content is excluded from traces. All other trace data — token usage, costs, timing, model information, and custom metadata — is still sent normally. See Privacy Mode for details.